1
/
of
1
Art | Global Temperature Stripes, 1880–2025 | One Line for Each Year
Art | Global Temperature Stripes, 1880–2025 | One Line for Each Year
Regular price
$19.99 USD
Regular price
Sale price
$19.99 USD
Quantity
Couldn't load pickup availability
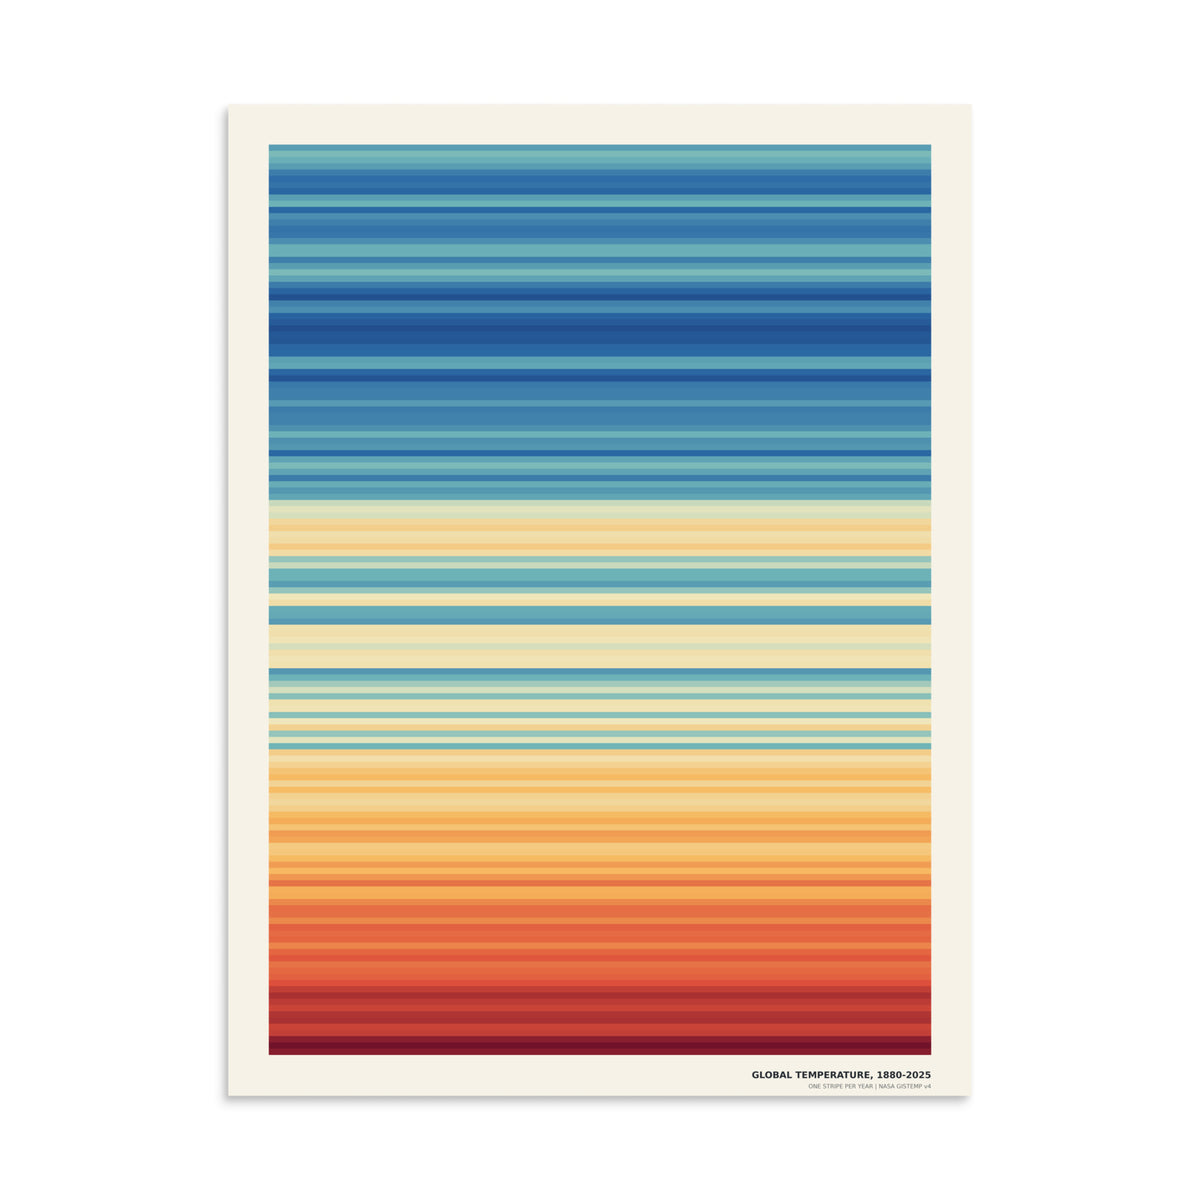
A visual history of Earth’s changing temperature. Each horizontal stripe represents one year, beginning with 1880 at the top and ending with 2025 at the bottom. Cooler years appear in blue, while warmer years transition through gold, orange, and deep red.
Created using annual global temperature data from NASA GISTEMP, this minimalist print turns nearly 150 years of climate data into a simple and striking piece of art.
This poster has a partly glossy, partly matte finish and it'll add a touch of sophistication to any room.
• 10 mil (0.25 mm) thick
• Slightly glossy
• Fingerprint resistant
• Paper sourced from Japan
This product is made especially for you as soon as you place an order, which is why it takes us a bit longer to deliver it to you. Making products on demand instead of in bulk helps reduce overproduction, so thank you for making thoughtful purchasing decisions!
Created using annual global temperature data from NASA GISTEMP, this minimalist print turns nearly 150 years of climate data into a simple and striking piece of art.
This poster has a partly glossy, partly matte finish and it'll add a touch of sophistication to any room.
• 10 mil (0.25 mm) thick
• Slightly glossy
• Fingerprint resistant
• Paper sourced from Japan
This product is made especially for you as soon as you place an order, which is why it takes us a bit longer to deliver it to you. Making products on demand instead of in bulk helps reduce overproduction, so thank you for making thoughtful purchasing decisions!
Share